Unveiling the Power of Data Preprocessing and EDA: Insights from Innoquest Cohort-1 Assignment 2
As part of the Data Science module in the Innoquest Cohort-1 program, Assignment 2 provided a hands-on opportunity to work with exploratory data analysis (EDA), data encoding, and preprocessing. This exercise not only polished practical skills but also reinforced the learnings from DigiSkills’ Data Analytics and Business Intelligence course. Here’s a breakdown of the key takeaways and processes involved.
The objective of the Assignment
The goal was to clean and preprocess the Lending-company.csv dataset, enabling it for further analysis. The tasks involved the following steps:
1. Data Exploration:
Understanding the dataset structure and summarizing key statistics.
2. Column Operations:
Dropping irrelevant columns such as LoanID and StringID.
3. Data Encoding:
- Map Product categories: Product A (0), Product B (1), and Product C-F (2).
- Replace missing
Gendervalues with the column mode.
4. Location and Region Handling:
Extract numerical values, ensuring proper data types.
5. Handling Missing Values:
- Fill
TotalPricemissing values with the column mean. - Drop rows with missing date values, then extract
MonthandWeekdayas separate columns.
6. Loan Status Preprocessing:
- Drop rows with missing or blocked statuses.
- Map loan statuses: Active (0) and Finished Payment (1).
7. Custom Adjustments:
Address challenges like TotalDaysYr based on observations.
Approach to Analysis and Solution
Step 1: Dataset Exploration
The first step was to load and inspect the dataset using Python. A quick look at the dataset provided insights into its shape, columns, and missing values.
import pandas as pd
df = pd.read_csv("Lending-company.csv")
df.head()
Key Findings:
- Several columns required preprocessing.
- Missing values were present in critical columns like
TotalPriceandStartDate.
Step 2: Data Cleaning
Dropping unnecessary columns like LoanID and StringID streamlined the dataset for further processing:
df.drop(['LoanID', 'StringID'], axis=1, inplace=True)Step 3: Encoding Categorical Variables
Products and Gender were encoded to numeric representations for consistency and analysis:
df['Product'] = df['Product'].map({'A': 0, 'B': 1, 'C': 2, 'D': 2, 'E': 2, 'F': 2})
df['Gender'].replace('NotSpecified', df['Gender'].mode()[0], inplace=True)
Step 4: Extracting and Converting Values
Numerical extraction from Location and Region ensured they could be used in computations:
df['Location'] = df['Location'].str.extract('(\d+)').astype(float)
df['Region'] = df['Region'].str.extract('(\d+)').astype(float)
Step 5: Handling Missing Values
Filling or removing missing values was crucial to maintaining data integrity:
df['TotalPrice'].fillna(df['TotalPrice'].mean(), inplace=True)
df.dropna(subset=['StartDate'], inplace=True)
Extracting Month and Weekday from the StartDate column enhanced temporal analysis:
df['StartDate'] = pd.to_datetime(df['StartDate'])
df['Month'] = df['StartDate'].dt.month
df['Weekday'] = df['StartDate'].dt.weekday
df.drop('StartDate', axis=1, inplace=True)
Step 6: Final Adjustments
Loan statuses were cleaned and encoded, and rows with blocked statuses were removed:
df = df[df['LoanStatus'] != 'Blocked']
df['LoanStatus'] = df['LoanStatus'].map({'Active': 0, 'Finished Payment': 1})
Reflections and Learnings
This assignment not only refreshed my understanding of EDA but also highlighted the importance of preprocessing in preparing data for machine learning. Revisiting concepts from the DigiSkills course reinforced my confidence in tackling real-world data challenges.
Key Takeaways:
- Data cleaning and preprocessing are essential for accurate analysis.
- Encoding and handling missing values require context-specific decisions.
- A structured approach ensures clarity and efficiency.
Analysis Performed
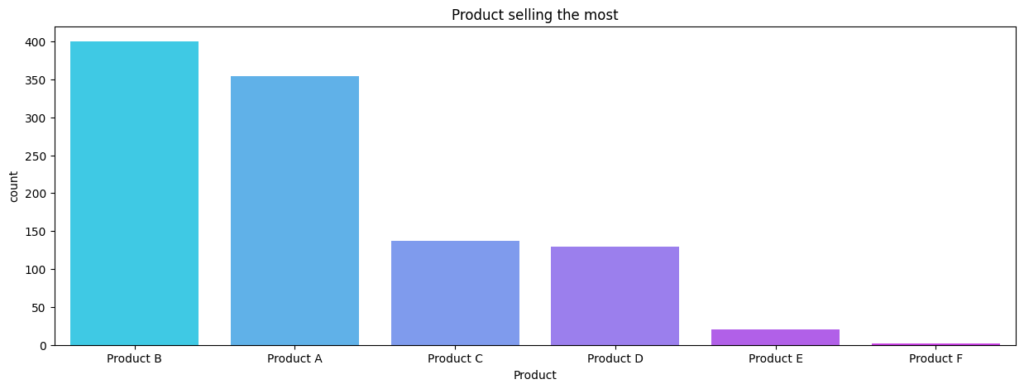
1. Exploring Customer Trends
By examining the dataset, I identified that most customers preferred products in category B, indicating its higher demand compared to others. This insight could guide marketing and inventory decisions.
2. Revenue Insights
Analyzing the TotalPrice column revealed that higher revenues were associated with locations in region codes 3 and 5. Businesses could focus their sales efforts in these regions to maximize profits.
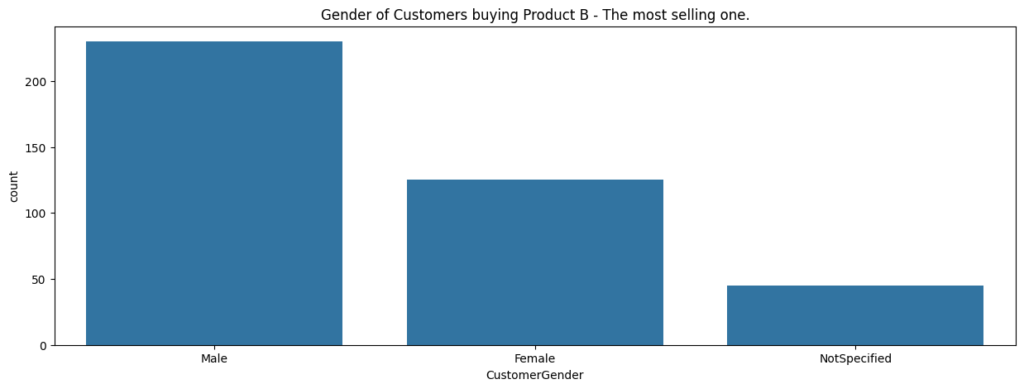
3. Gender Dynamics
Replacing unspecified gender values with the mode showed that most customers were male. As the majority of buyers are men, the business can enhance its product recommendation system to recommend relevant products that are more focused on men to increase sales or consider adding more related products to its catalog.
4. Loan Status Analysis
Examining loan statuses revealed that the majority of loans were active, highlighting a substantial ongoing revenue stream. This insight suggests the business can focus on improving the repayment process for active loans to maintain a steady cash flow.
Actionable Recommendations for Revenue Growth
Focus on Product B in Specific Regions:
The gender dynamics analysis highlighted a majority of male customers. Instead of targeting female borrowers, the business can leverage this insight by focusing on promoting Product B (the most sold product) in high-revenue regions like 3 and 5 to further increase sales.
Region-Focused Strategies:
High revenues from regions 3 and 5 indicate these areas as lucrative. Expanding promotional offers or partnerships in these regions could enhance profitability.
Optimize Resource Allocation:
The temporal insights suggest reallocating staffing during weekdays and March peaks to better cater to demand.
Improve Loan Management:
For active loans, introducing incentive programs for early repayment or streamlining payment schedules could improve customer retention and cash flow stability.
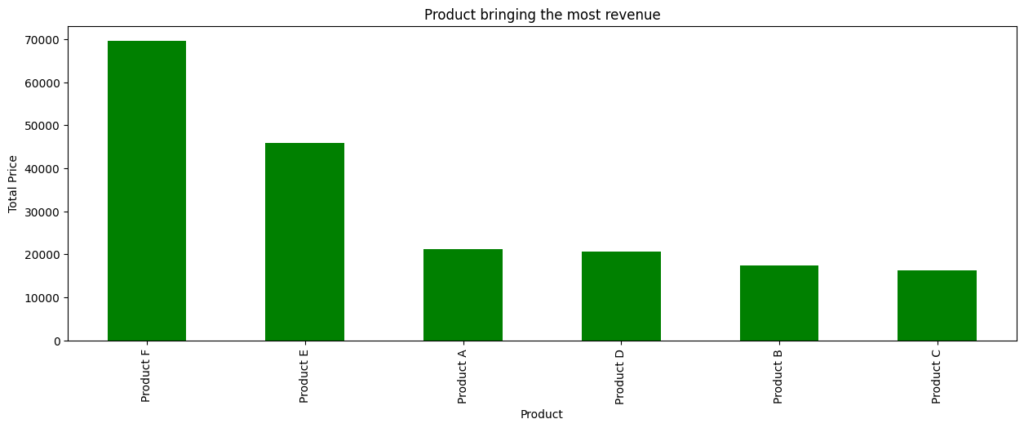
Enhance Product F Recommender System:
Product F generates the most revenue due to its higher price point. By recommending complementary gadgets/products related to Product F or offering bundled packages, the business can further increase its profitability.
Some Visuals